
When a structural engineer, like me, hears or reads the word “analysis” then you will get full attention. That happened when I was discussing some architectural topics with my colleague Colin McCrone. He got my full attention, like a hypnotized patient to his shrink, when he gave me an example of “Line Of Sight Analysis”. Hah, “analysis”, that’s the magic word!
When buildings are designed, it is also necessary to think about the comfort of people living in it. And in that perspective, the line of sight is very important, if you ask me. I have been working for many years in offices: ‘landscape’ offices with no windows, offices where the sill was positioned at 1.8 m height (and this was no basement !), to office spaces with waaaaay to much windows (and thus too much sun) … Now I have my home office space (with one small window) or the airplane (with very tiny windows). So I got personally attracted by this example.
In this post I will explain you how you can analyze and visualize the line of sight of a human being in a specific room with Revit and Dynamo. As usual, at the bottom of this post you’ll find a demo video and the datasets.
Eye point
In this part of the script you select the Revit family that represents the eye point with the Select Model Element node. In the video below this is represented by a sitting man. As the FamilyInstance.Location takes the insertion point of this family we need to add the vector that points to the “eyes” of the human, which are at approximately 1.3 m here.

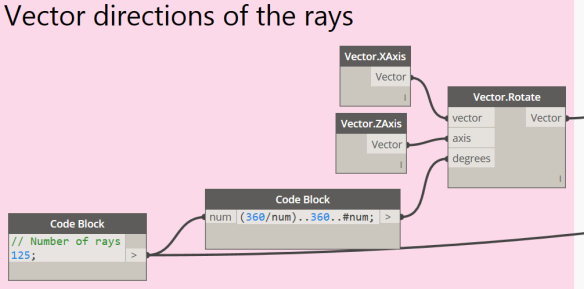
Vector Directions
Another input we need are the vector directions of the rays. Or with other words, which are the directions the eyes will look, assuming that the head and body can turn around too of course.
Ray Casting
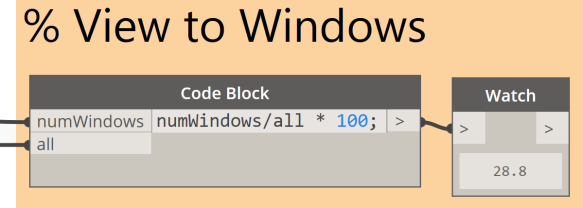
These two inputs are then connected to the RayBounce.ByOriginDirection node. This node will send out the rays and return two outputs: points at the intersection of the ray with the first touched object in its direction and the element which is hit by the ray. The points can be used to visualize the rays with PolyCurve.ByPoints and the elements are filtered out with the Element.IsOfCategory (from the Clockwork package). In this case we need to find out which hit elements are Windows. This will define the colors of the rays.

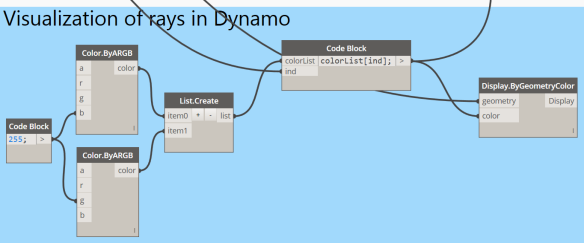
Visualization of rays
By translating the boolean results from previous step into colors, we can visualize the rays. In this case green rays hit the windows and the blue rays hit other objects. In the same way these rays are reproduced in Revit with Model Lines. The change the color of these model line, you will need the custom node Line.ColorOverride which is included in the datasets below.
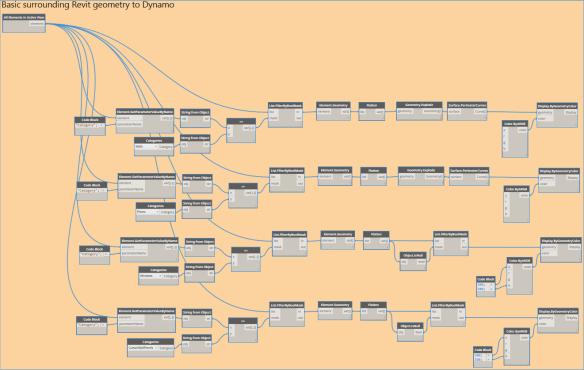
 Revit geometry in Dynamo
To interpret the results better in Dynamo you’ll need the surrounding Revit geometry. This is done simultaneously with the large group of nodes at the bottom of the script.
Results
The final results look like this.
In Dynamo

In Revit

Special thanks to Nate Holland and Andrew Heumann who were the initial “inspirators” for this.
Dataset
The Dynamo file and the “Sitting Man” family can be downloaded on this link.
As for the Revit file, you can simply use the “rac_advanced_sample_project.rvt” file from the Revit Sample Files.
Demo video

Amazing! I can imagine using this by making a stadium, a teather or even a cinema! Thanks for sharing.
Instead of a 360 sightline can you do a point to point with a large number of rays? This would be helpful for an auditorium of stadium.